I was helping out a consumer of Have I been pwned? (HIBP) earlier today as they were trying to build up a profile of the pwnage state of their client base. This mean firing a heap of requests at the API so that they could assess a very large number of accounts. I’m always interested in how far this service can be stretched and indeed what the thresholds are before Azure starts applying auto-scale magic.
First up, keep in mind that each request to the API is searching through 175 million records in Azure Table Storage. You can read about the story of HIBP for background on why I chose this data structure but one of the key reasons is scale – it’s massive!
Anyway, here’s what I started seeing early this morning courtesy of New Relic:
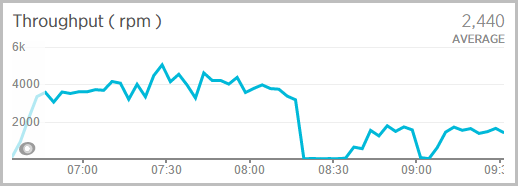
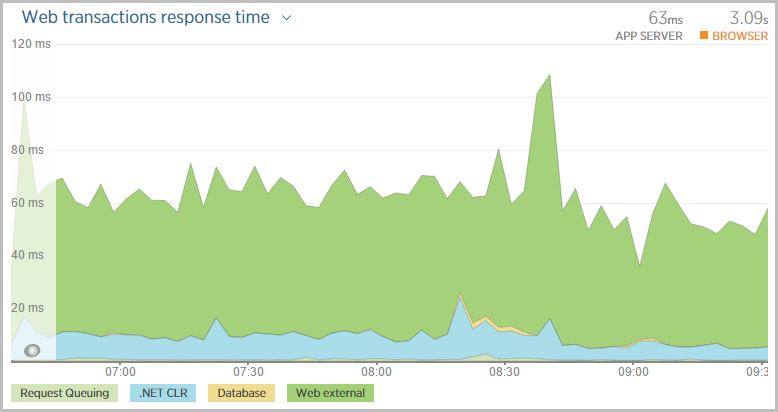
That’s peaking out at about 5k requests per minute. During this time, the entire request processing sat reasonably steady around 60ms:
What’s interesting though is the CPU usage – here we can see everything starting out with a single instance (the yellow line) and then adding a second instance (the blue line) about a third of the way through:

Comparing that with the previous chart, we can see the web transaction response time doesn’t miss a beat. There was no adverse impact on the perf as the CPU sat around 50% because when it dropped to half that with two instances, we can still see that 60ms time.
The thing that’s evident above is that the “yellow” instance sat at about 50% for quite some time before the “blue” instance came online. This all comes down to how auto-scale is configured. After a lot of playing around during previous high load scenarios, I ended up reverting to the Azure defaults which look like this:
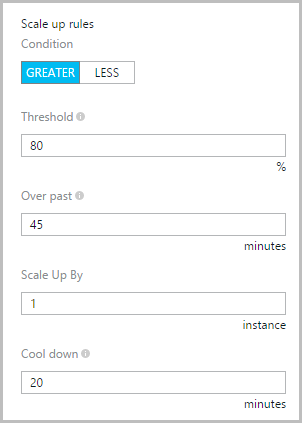
What this means is that if the CPU sustains an 80% utilisation over a 45 minute period, another instance will be added. It will then wait another 20 minutes before scaling again. But New Relic shows only 50% – what gives?! Looking in the Azure portal, it’s reporting just over 80%:
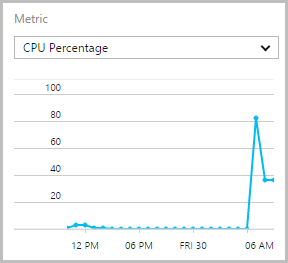
I’m not entirely sure why their metrics differ other than to speculate that there are two separate monitoring processes (obviously) which may report on the data slightly differently. Regardless, clearly this is quite a lot of load and the fact that the site has scaled with zero perceptible degradation to service beforehand is enormously pleasing.
Getting back to the first graph above, the load clearly backs off a little bit later and we can then see the CPU graph drop an instance some time after that. This is due to the scale down rule in Azure:
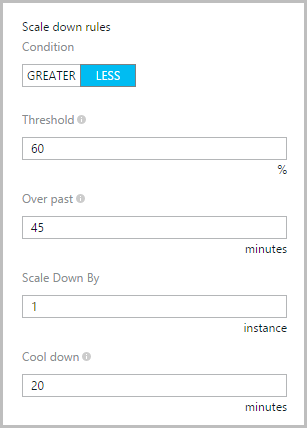
Similar sort of deal to scale up but inverse: once the average CPU utilisation gets below 60% over the prior 45 minutes, one instance will be removed. Give it 20 minutes then take away another one if it’s still below 60%.
Another metric worth watching is the Apdex which is New Relic’s user satisfaction measurement. This is almost always in the green and again, shows no perceivable degradation related to the scale of infrastructure when it’s either added or removed:
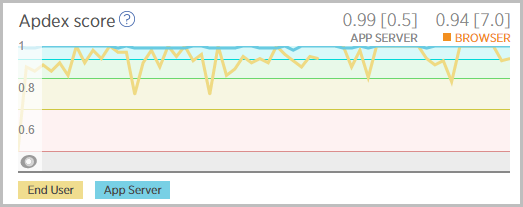
Again, the point being that' resources were added soon enough and taken away late enough not to impact customers.
And finally, errors. This speaks for itself:
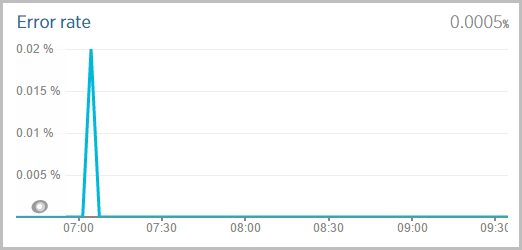
That’s one in every 200,000 requests. Later in the day after the system was hammered for the better part of 12 hours, the error rate dropped to 0.0002% over about 2.4 million requests.
Throughout all this, I didn’t touch a thing. As the consumer of the service stopped things on their end, made tweaks and started them again, instances were removed and added such that there was no perceptible change in response time.
I spoke with the guys using the service during the day and got some insight into what they observed at their end. Firstly – and this was very kind of them – they were worried about the cost impact on me of all these requests. Well, a standard website on a small VM is 10c an hour so if you run this non stop for the entire business day and I’ve scaled up by an instance, I am going to have to come up with 80c!
The other interesting observation was that their back end process was the bottleneck that effectively rate-limited the service consumption to usually around 4k requests a minute. Querying those 175 million records, serialising the response and sending it down the wire wasn’t the problem, inserting the data fast enough at the other end was!
This, IMHO, is how cloud services should work: minimum viable infrastructure footprint, early scale-up and late scale back with a commoditised pricing model that bills you down to the minute. This is what keeps this service running on a coffee budget whilst at the same time serving millions of requests on a busy day. That’s a rather awesome combination I reckon.
