Back in 2016, I wrote a blog post about the Martin Lewis Money Show featuring HIBP and how it drove an unprecedented spike of traffic to the service, ultimately knocking it offline for a brief period of time. They'd given me a heads up as apparently, that's what the program has a habit of doing:
I Just wanted to get in contact to let you know we're featuring 'have I been pwned?' on the programme next week (Monday 28 Nov, 8pm, ITV) saying it's a good way to check if your data has been compromised. I thought it best to let you know in case you need to put extra resources onto it, we do have a tendency to crash websites with traffic!
Full of cloud-fuelled bravado, I expected everything to tick along just fine until... I lost a third of the requests going to the website. Only for a couple of minutes, but enough to upset me just a little bit.
Last week, the show reached out again. "Round 2", I'm thinking, except this time I'm ready for crazy traffic. Over the last 3 and half years I've invested a heap of time both optimising things on the Cloudflare end (especially as it relates to caching and Workers) and most importantly, moving all critical APIs to Azure Functions which are "serverless" (which runs on servers ?♂️). I made a note in my calendar for when the show would be on (6am this morning in Australia), went to bed the night before and... forgot about it. I didn't scale anything in advance (in fact I'd just scaled the SQL DB down after loading a breach on the weekend), didn't tweak anything or make any other changes, I just left it. I then get up this morning and see the tweets:
. @troyhunt Awesome Prime Time TV explanation of @haveibeenpwned on ITV in the UK by @MartinSLewis pic.twitter.com/auS5dBd9GF
— Martyn Jones (@thurboman) February 24, 2020
So, @troyhunt’s @haveibeenpwned was just featured on @itvMLshow. Let’s see if it holds up.…
— Michael (@michaelw90) February 24, 2020
@troyhunt They just mentioned @haveibeenpwned on the @itvMLshow and told people to not go onto the website all at once because "last time it crashed the site". Is that true or are they just trying to talk up the impact they have?
— Jeppe Fihl-Pearson (@Tenzer) February 24, 2020
Oh yeah, that was true last time, but let's see what happened today...
We'll start with the origin web server which was the one handling all the traffic last time. Here's what App Insights reports over the period where HIBP hit the air:
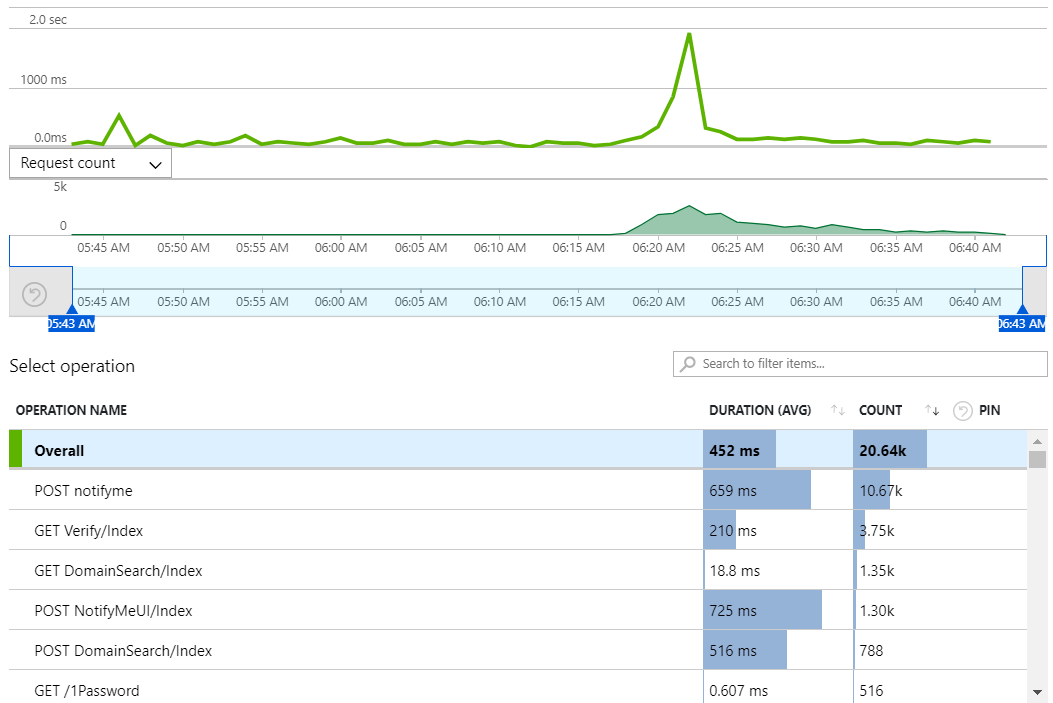
There were just over 20k requests across the entire 1-hour period, predominantly POST requests on the "notifyme" resource which is used when you subscribe for notifications should you appear in a future data breach. The top result is the async request to the API made from the modal that pops up on the page, the 4th result is when the POST happens directly from the dedicated notification page.
The thing that's most interesting about the traffic patterns driven by prime-time TV is the sudden increase in requests. Think about it - you've got some hundreds of thousands (or even millions) of people watching the show and the HIBP URL appears in front of them all at exactly the same time. They simultaneously pick up their phones, enter the URL and smash the service, all within a very small window of time. Let's look at how quickly that traffic changed, starting with a slice of time just before HIBP appeared on the screen:
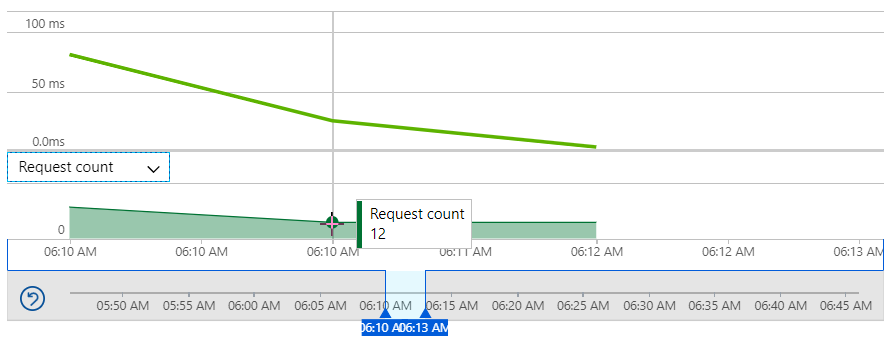
That's 12 requests per minute to the origin website. Then, only a handful of minutes later:
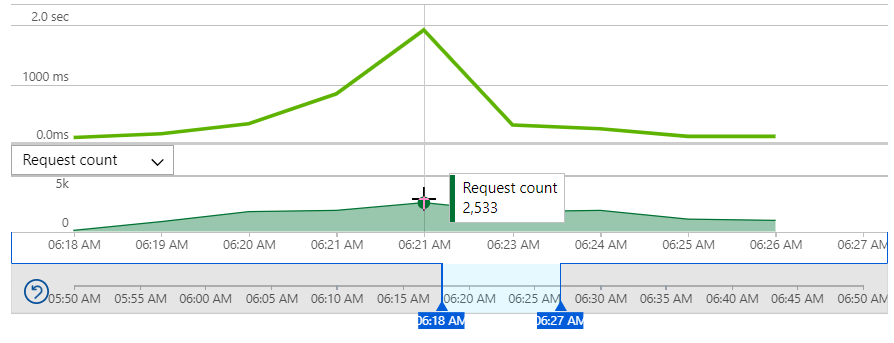
Now we're at 2,533 requests per minute so the headline story here in terms of rate of change is traffic increasing 211 times over in a very short period of time. The last time that happened in 2016, the error rate peaked at about a third of all requests. This time, however, the failed request count was...
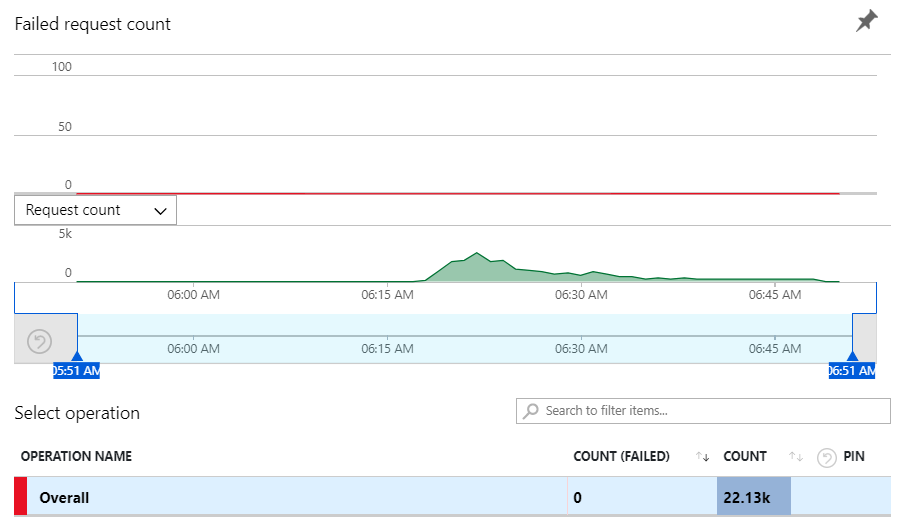
Zero ?
But that's just the origin website and since the last round with Martin Lewis, it doesn't actually serve the requests to search the HIBP repository of email addresses in breaches. All that is now farmed off to a dedicated Azure Function called "Unified-Search" that scans both breaches and pastes in async so let's see how that performed:
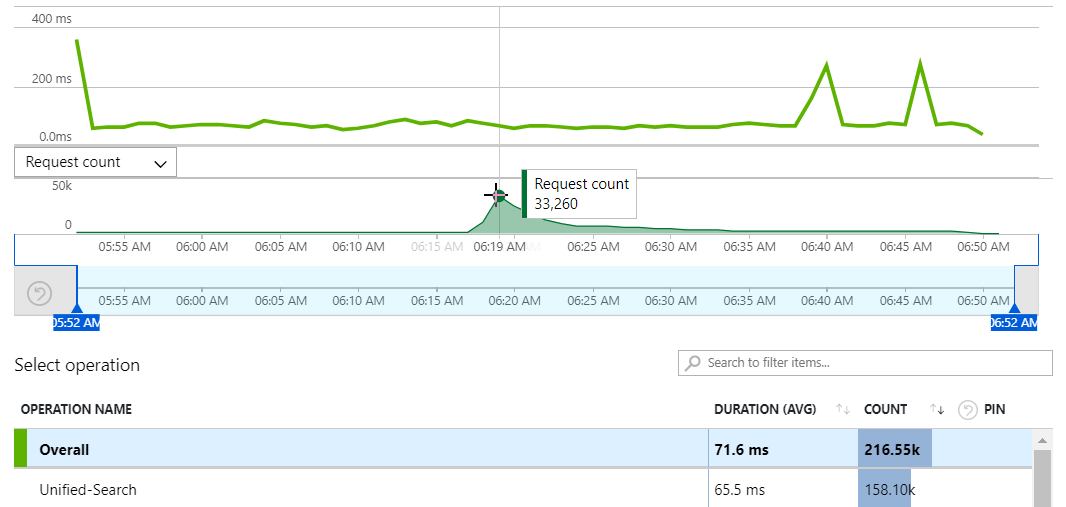
That's a peak of 33,260 requests per minute or in other words, 554 requests per second searching 9.5 billion breach records and another 133 million pastes accounts at the same time. The especially cool thing about this chart is that there was no perceptible change to the duration of these requests during the period of peak load, in fact the only spikes were well outside that period (I assume related to something going on with the underlying Table Storage construct). This feature is the real heart of HIBP so naturally, I was pretty eager to see what the failure rate looked like:
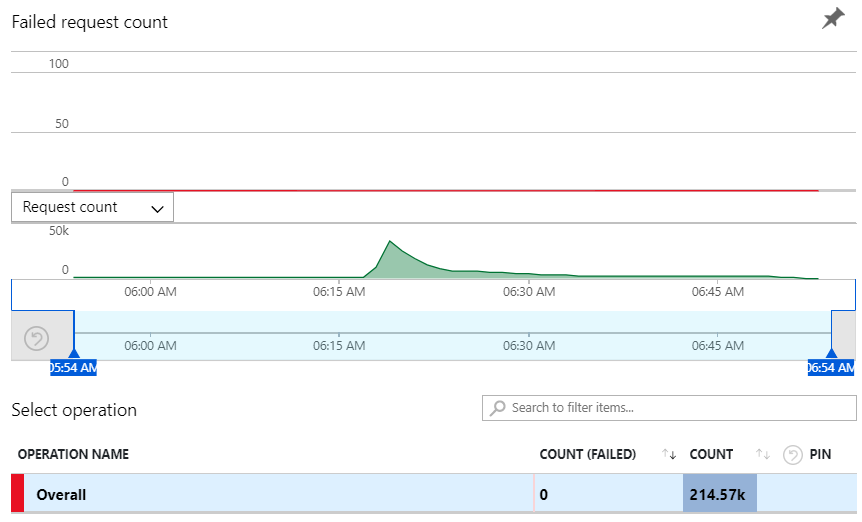
Zero. Again ?
So onto the SQL database which manages things like the subscriptions for those who want to be notified of future breaches. (This runs in an RDBMS rather than in Table Storage as it's a much more efficient way of finding the intersection between subscribers and people in a new breach.) Here's the Data Transfer Units (DTUs) which measure DB load:
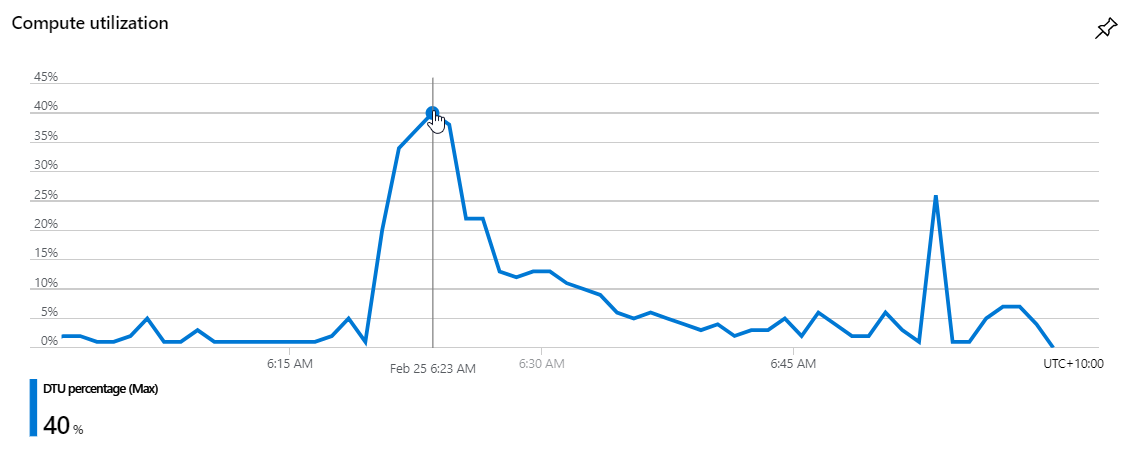
It peaks at about 40% utilisation which is something I probably need to be a little conscious of, but this is also only running an S2 instance at A$103 per month. More on that later.
Adding it all up, that peak minute at about 06:20 saw 2,533 requests to the website and another 33,260 to the API running on Azure Functions so call it about 36k requests all up hitting the origin(s). Compare that to the 2016 load:
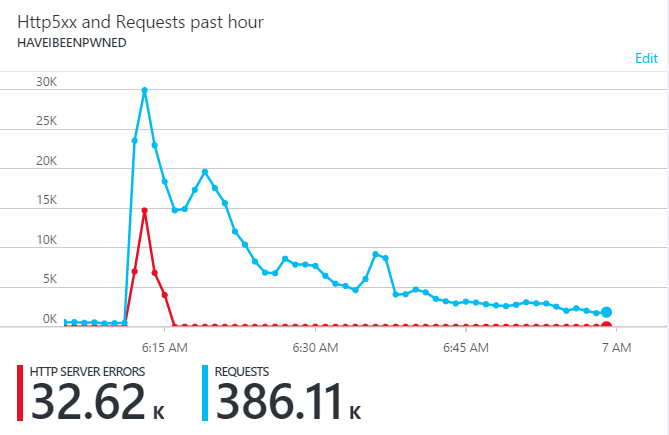
That was about 45k requests at peak with a third of them lost to errors so... was there more traffic back then? There was more to the origin, but not to the service and the difference all has to do with Cloudflare. Here's the 2016 graph of requests as they measure it at the edge:
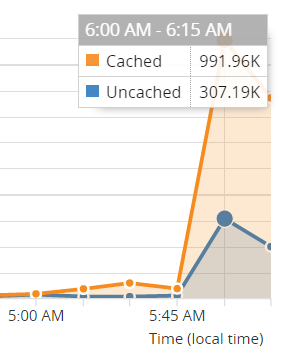
That's about 1.3M requests during the busiest 15-minute period which includes everything from the homepage load to the API hits to notification signups to images and other static content. Now here's today's number:
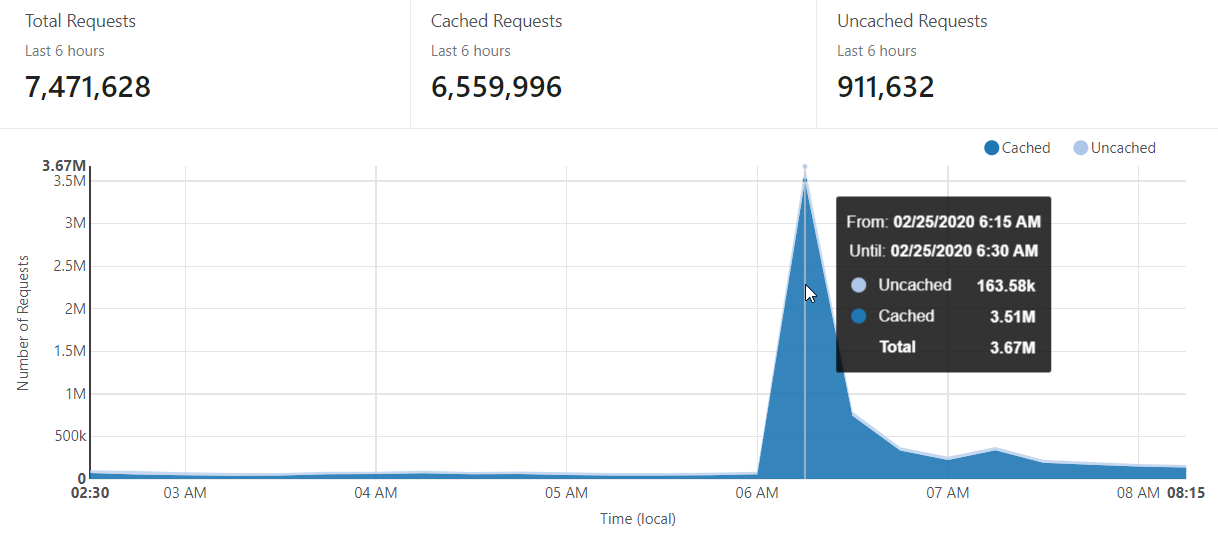
That's 3.67M in the busiest 15 minutes so more than double the 2016 traffic. The big difference between the 2016 and 2020 experiences is that there's now much more aggressive caching on the Cloudflare end. As you can see from the respective graphs, previously the cache hit ratio was only about 76% whereas today it was all the way up at 96%. In fact, those 163.58k uncached requests is comprised almost entirely of hits to the API to search the DB, people signing up for notifications and the domain search feature so in other words, just the stuff that absolutely, positively needs to hit the origin. Mostly - there's still a bunch of things I can tweak further:
- GET requests to the domain search page were the third most frequent calls to the origin website. They're not presently cached because they serve up antiforgery tokens as a CSRF defence and they need to be unique per request. Frankly, there's very little value in that, especially when there's already anti-automation on the page which can be served from a cached resource.
- GET requests to the 1Password page weren't being sufficiently cached. This was a page rule missing in my Cloudflare configuration and its now been rectified.
- POST requests to the notification page averaged around 700ms and spiked at almost 2 seconds. The DTUs on the SQL DB suggest that this is where the bottleneck is so ideally, I'd just drop any new subscriptions into a message queue, respond (almost) instantaneously to the user then process them in the background. That'd also avoid a situation where the DB got really hammered and caused new subscriptions to be totally lost.
What I like most about the outcome of this experience is not that HIBP didn't drop any requests, but rather that I didn't need to do anything different to usual in order to achieve that. I was just reading the summary of the 2016 post where I lamented that a mere 40c more spent by manually scaling up the infrastructure in advance would have handled the traffic. Pft! I don't even want to think about traffic volumes and that's the joyous reality that Azure Functions and Cloudflare brings to HIBP ?