For the most part, Have I Been Pwned (HIBP) runs very smoothly, especially given how cheaply I run many parts of the service for. Occasionally though, I screw up and get something wrong that interrupts the otherwise slick operation and results in some outage. Last weekend was one such occasion and I want to explain what I got wrong, how you might get it wrong too and then, of course, how to fix it.
But first, some background: A few months ago I announced that Mozilla and AgileBits were baking HIBP into Firefox and 1Password (I'll call them "subscribers" in this post). They're leveraging the anonymity model described there to ensure their users can search for their identities without me ever knowing what they are. In addition, they can also sign those identities up to receive notifications if they're pwned in the future, again, via an anonymity model. The way the notifications work is that if an identity is signed up, it's just the first 6 characters of a SHA-1 hash of their email address that's sent to HIBP. If test@example.com is signed up, it's 567159 being those first chars which gets stored in HIBP. When I then load a data breach, every email address in the source data is hashed and if any begin with 567159 then a callback needs to be sent to an API on the subscriber's end. Because there may be multiple email addresses beginning with that hash prefixes, a collection of suffixes is sent in the callback and the subscriber immediately discards any that don't match the ones they're monitoring. For example, a callback would look like this:
{
  hashPrefix: "567159",
  breachName: "Apollo"
  hashSuffixes: [
    "D622FFBB50B11B0EFD307BE358624A26EE",
    "..."
  ]
}
You can see the breach name here is "Apollo" and that's an incident of some 126M email addresses which you can read about in this WIRED piece. That's a very large breach and I loaded it not long after Mozilla went live with their service which attracted a very large number of people who signed up for notifications via their service. This led to two very large numbers amplifying each other to create the total number of callbacks I needed to send after the data load.
Now, the way the callbacks work is they all go into an Azure storage queue with each new message triggering a function execution. Azure Functions are awesome because they're "serverless" which, in theory at least, means no logical infrastructure boundaries and you simply pay per execution. Except there are boundaries, one of which caused the aforementioned outage.
So that's the background, let's get onto what happened when the notification queuing process began lining up those hash range callbacks:

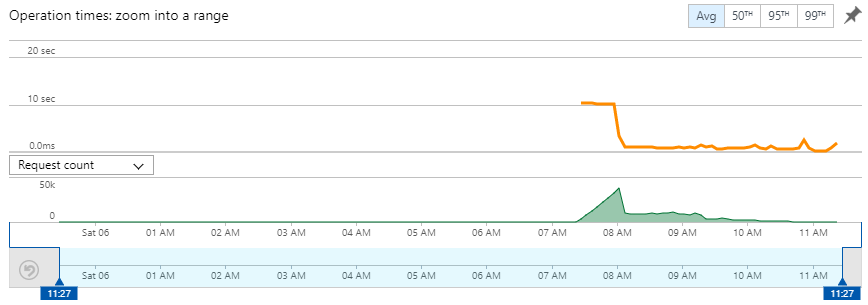
What you're seeing here in green the number of invocations of the Function and the orange line show you the average execution time. There's absolutely no action in the leadup to about 07:30 because there are no callbacks to send. However, that's when I started dumping them into a queue which in turn began triggering the function. You can see the steady ramp-up of executions as the Azure Function service spins up more and more instances to process the queue messages. You can also see the execution time flat-lining at 10 seconds all the way until just after 08:00. That's the first problem so let's talk about that:
The pattern above absolutely hammered Mozilla. I was looking at the logs as messages were queuing and noticed a heap of the callbacks being aborted at the 10 second timeout mark. This is the period that I set on the HttpClient object in the function so that a request isn't left hanging for too long if the receiver can't respond. I noticed it pretty quickly (this was the first load of a really big data set since they came on board so I was watching carefully) and reached out to them. They acknowledged the issue and logged a bug accordingly:
We are receiving a spike of HIBP callback requests which look up our subscribers by sha1 hash. The RDS node is maxing on CPU. :(
When I originally implemented the callback logic, I built a retry model where if the call fails it will put it back into the queue and set the initial visibility delay to a random time period between 1 and 10 minutes. The rationale was that if there were a bunch of failures like these ones here, it would be better to wait a while and ensure there's not a sudden influx of new requests at the same time. And more than 5 consecutive failures using that model would cause the message to go to a "poison" queue where it would sit until the message expired.
In theory, this is all fine; Mozilla was getting overwhelmed but the messages weren't lost and they'd be resent later on. Just to take a bit of pressure off them, I pushed a change which multiplied that visibility period by 10x so the message would appear between 10 and 100 minutes later. (The additional period doesn't really matter that much, it would simply mean that subscribers to Mozilla's service would receive their notification up to about an hour and a half later.) In pushing that change, I moved the definition of the minimum and max viability periods to config settings so I could just tweak them in the Azure portal later on without redeploying. And then stuff broke.
I didn't see it initially because it was Saturday morning and I was trying to have brekkie with the family (so yeah, it's really the kids' fault ?). Then I saw this:

I restarted the app service, but that didn't help. I then synced the latest code base from GitHub to my "stage" deployment slot then swapped that with production and the service came back up.
The @AzureFunctions service behind @haveibeenpwned went down earlier and the UI defaulted to a rate limit warning. Sorry folks, redeployed and it’s all good now, will look further into what went wrong later on.
— Troy Hunt (@troyhunt) October 5, 2018
Jeff Holan from the Azure Functions team noticed this and we then got down to troubleshooting. It didn't take long to work out the underlying issue:
In the consumption plan *today* there is a limit to 300 active network connections open at one time. If you cross that limit it locks down the instance for a bit. I see that even though we scaled out your app to a few different instances, many of them crossed the threshold for connections (on one for example I see 174 connections at one time to IP Address [Mozilla's IP address]).
Ah. And because the function which is triggered by the queue and does the callbacks runs in the same service as the function which is triggered by HTTP requests (i.e. the HIBP API), everything got locked down together at the same time. In other words, I broke Mozilla which in turn broke Azure. Cool?
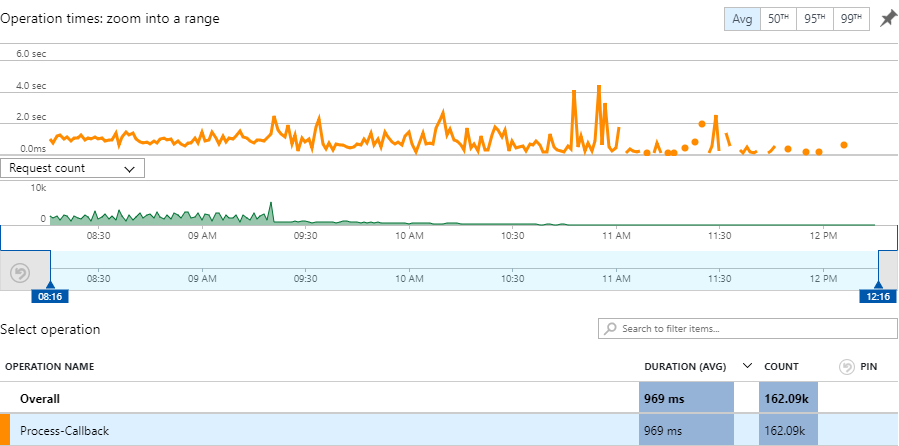
Let's move on to fixes because there are many simultaneous lessons to be learned here and the first is that timeout: 10 seconds is way too long. Here's a 4-hour graph of callbacks I snapped just after the original spike passed that window and as you can see, the average execution time is now less than 1 second:

As such, I dropped the timeout down to 3 seconds. This whole thing was made much worse than it needed to be due to multiple connections sitting there open for 10 seconds at a time. Fail early, as they say, and the impact of that comes way down. And remember that this doesn't mean the callback is lost, it just means that HIBP will give it another go a bit later. It's still a window that's 3x longer than what's required on average and not only does it protect HIBP, it also protects my wallet because functions are charged based on the amount of time they spend running.
Next up is that 300 active network connections limit and Azure has now doubled it. Not just for me, but Azure has just begun rolling out updates that take the limit to 600 and it's just coincidental that my problems occurred a few days before the change. I feel much better about this in terms of the whole philosophy of "serverless"; remember, the value proposition of this approach is meant to be that you escape from the bounds of logical infrastructure and you pay per execution instead. However, there are still points where you hit those logical limits and anything that can raise that bar even further is a good thing.
Speaking of which, my own code could have been better. Jeff pointed out that it's important to reuse connections across executions by using a static client. I wasn't doing that and was missing a dead simple performance optimisation that's clearly documented in How to manage connections in Azure Functions:
DO NOT create a new client with every function invocation.
So now the code looks precisely like the example in the link above:
// Create a single, static HttpClient
private static HttpClient httpClient = new HttpClient();

public static async Task Run(string input)
{
    var response = await httpClient.GetAsync("http://example.com");
    // Rest of function
}
Then there's the way I caused traffic to ramp in the first place and as of Saturday, that was basically "dump truck loads of messages in the queue in the space of a few minutes". This causes a massive sudden influx of traffic which can easily overwhelm the recipient of the callbacks and I totally get how that caused Mozilla headaches (certainly I've been on the receiving end of similar traffic patterns myself). The change I've made here is to randomise the initial visibility delay when the message first goes into the queue such that it's between 0 and 60 minutes. When a subscriber is monitoring a large number of hash prefixes that's still going to hit them pretty hard, but it won't be quite the same sudden hit as before and again, a little delay really doesn't matter that much anyway. Plus, as more subscribers use this particular service, the randomised visibility period will ensure a more even distribution among who receives callbacks when regardless of the sequence with which messages are inserted into the queue.
So that's what happened, what I've learned and what I've changed. It's a reminder of the boundaries of serverless (even when that 300 connection limit doubles) and that there are usually easy optimisations around these things too. I could go further yet too - I could put callbacks in a separate app service and isolate them from the API other people are actually hitting. I'm certainly not ruling that out for the future, but right now everything detailed above should massively increase the scope of the service and isolating things further is almost certainly premature optimisation at this point.
Lastly, I've been marching forward on a mission to move more and more code into Azure Functions. As of just yesterday, every API that's now hit at scale sits in a function and I've used Cloudflare workers to ensure requests to the original URLs simply get diverted to the new infrastructure. As such, I'm going to end this blog post with a momentous occasion: I've just scaled down the HIBP App Service that runs the website to half the size and, most pleasingly, half the cost ?
